Add Data to your Graph#
You can add data from Circa’s database or create your own nodes from scratch.
From the Graph#
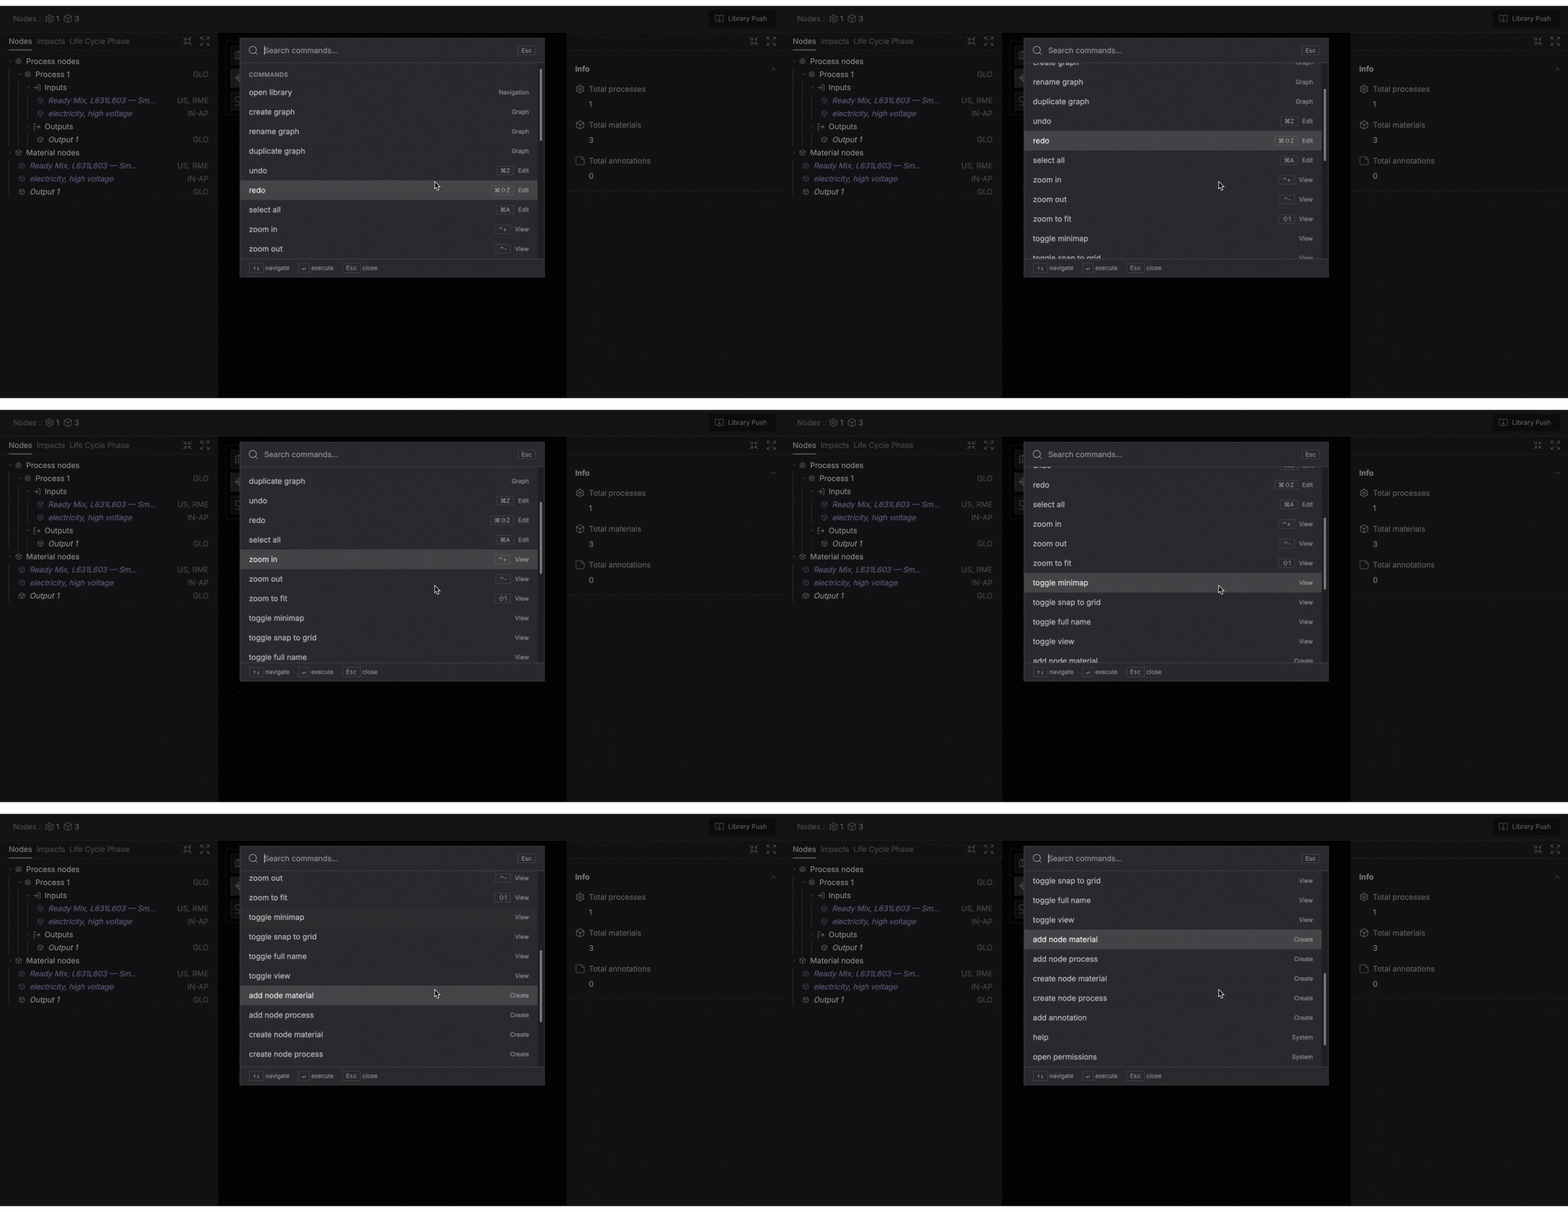
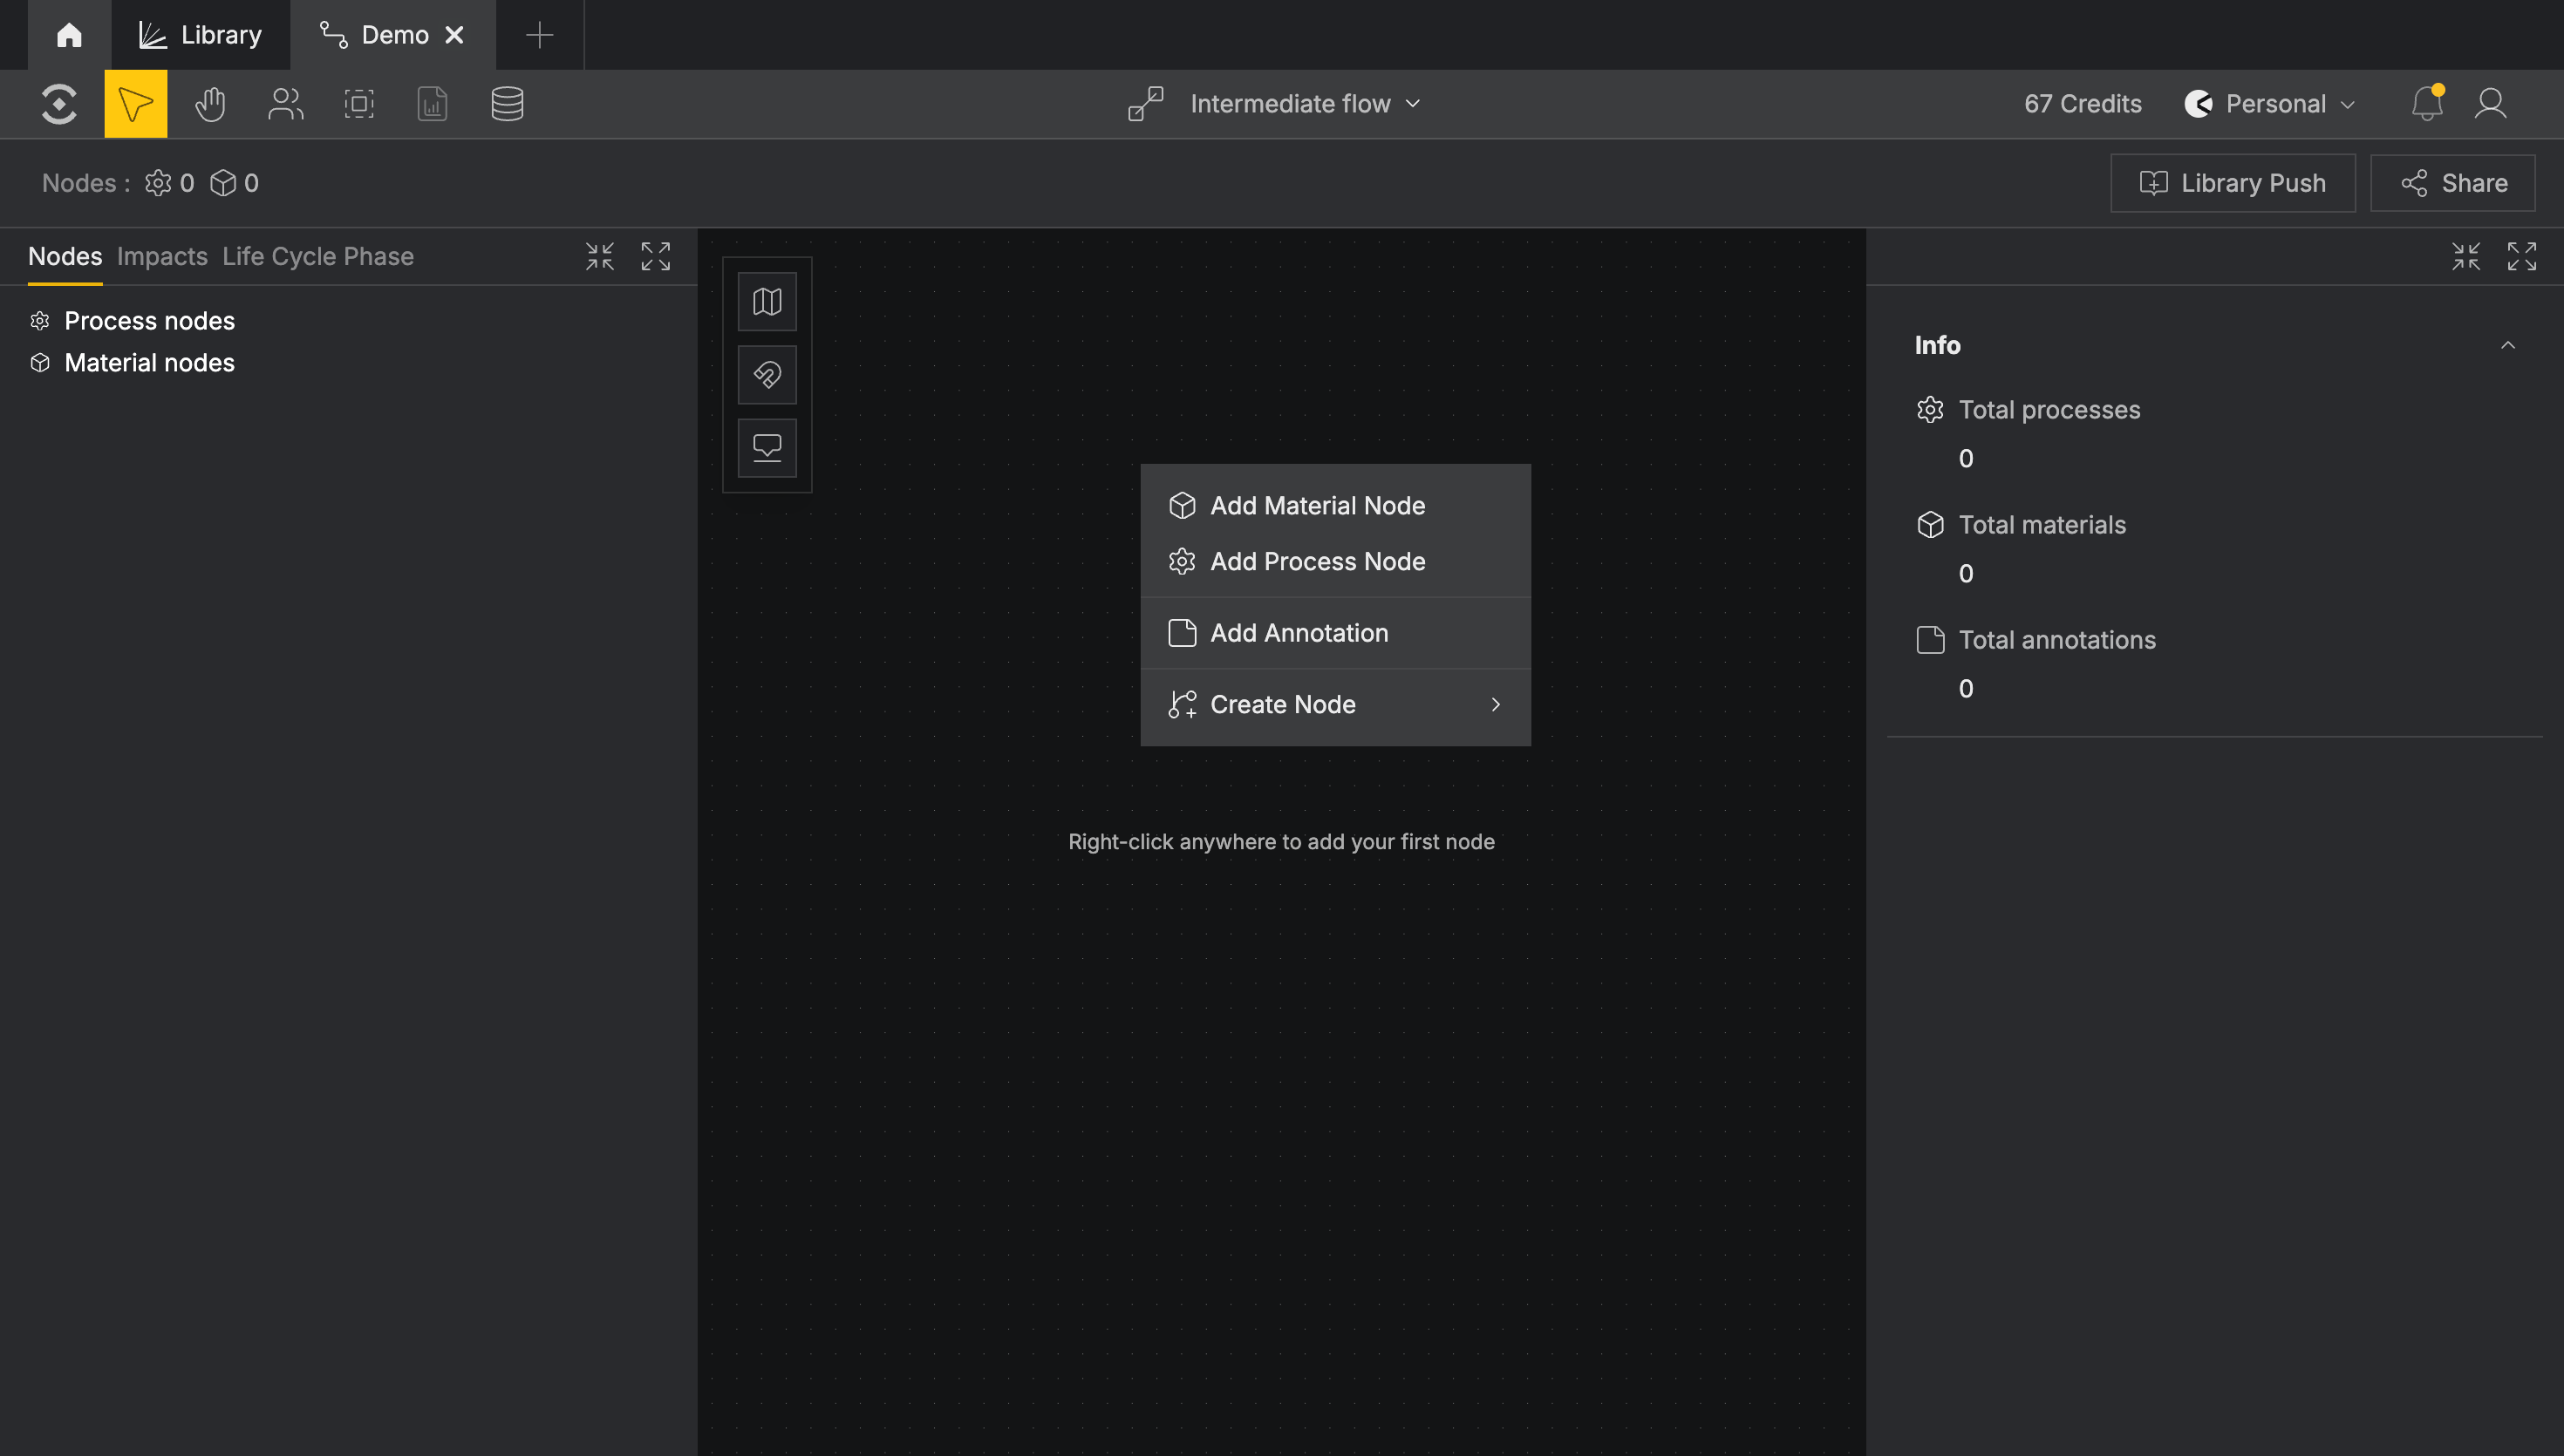
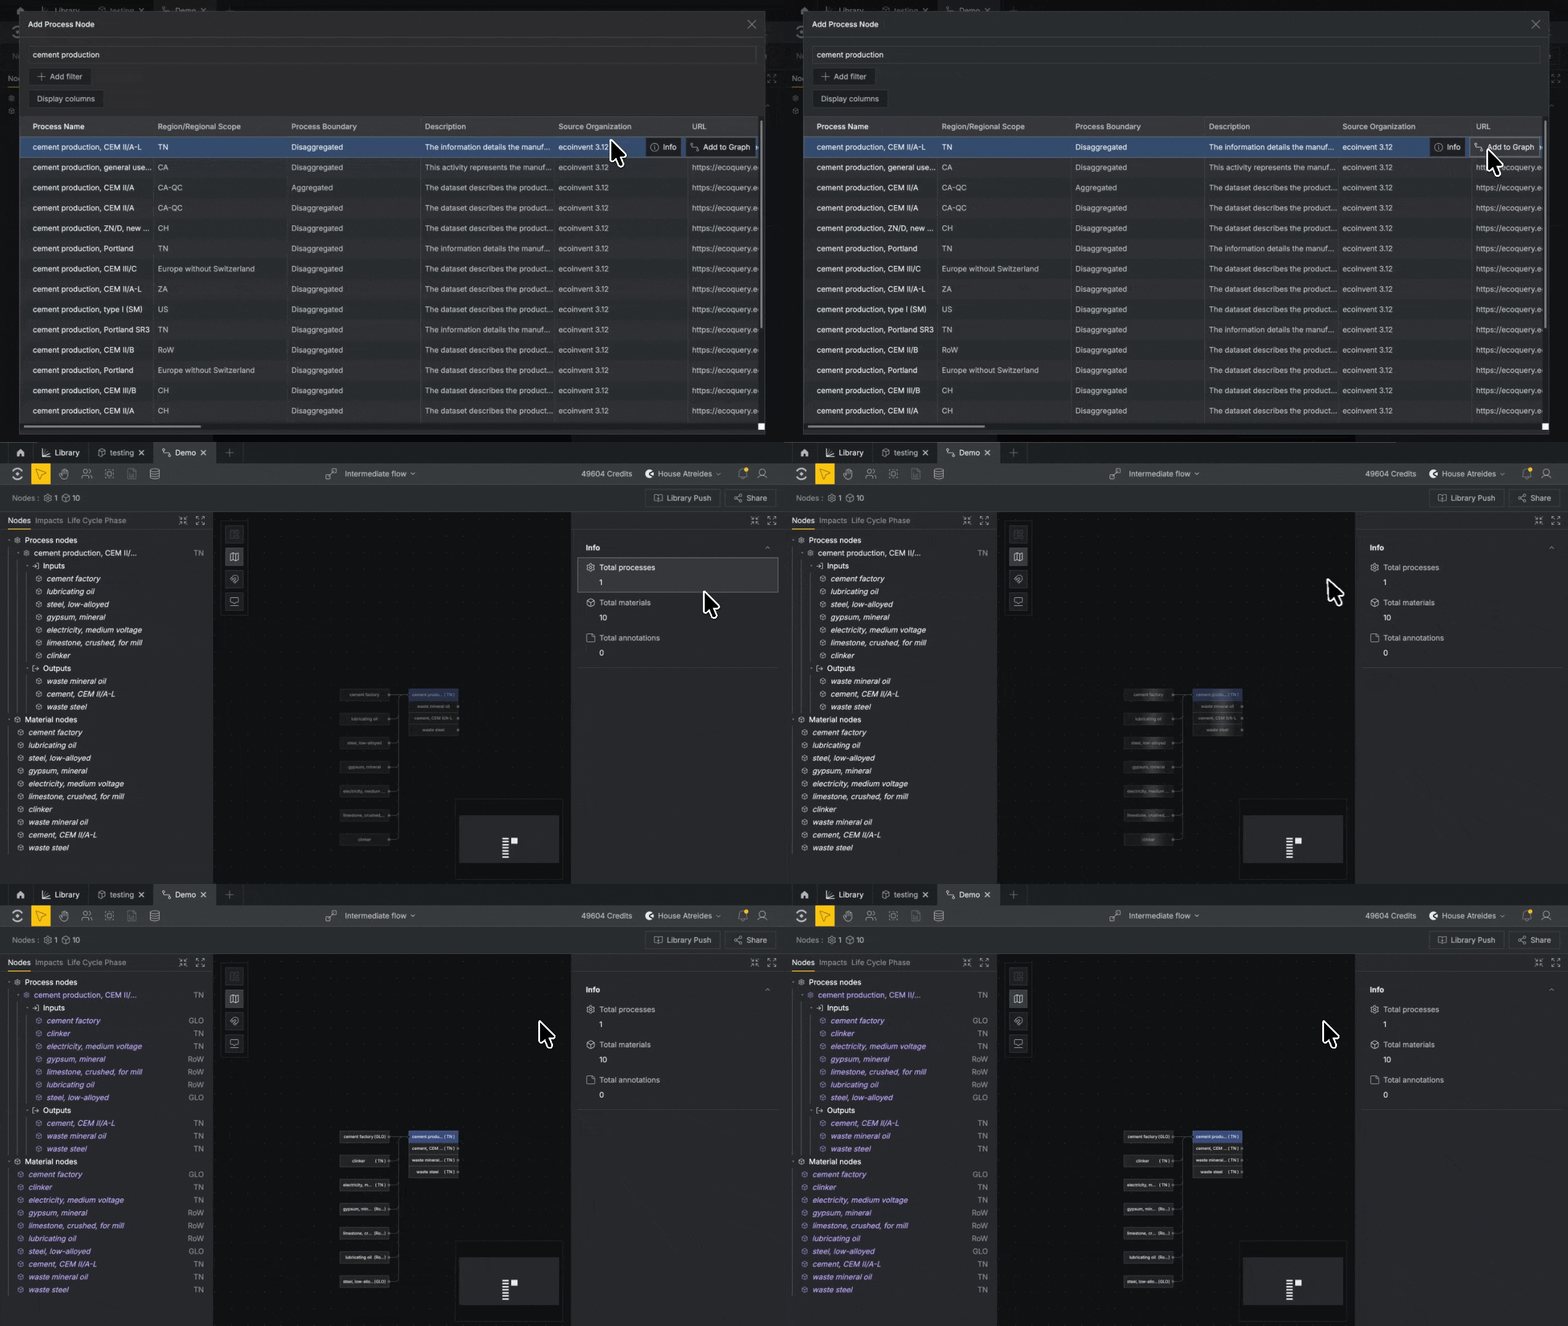
Right-click anywhere on the canvas to begin. Click Add Process Node to add your first dataset to the graph. Use the search bar and geography filter to find the right dataset.
Click the Library icon on the right of any row to view the full dataset information.
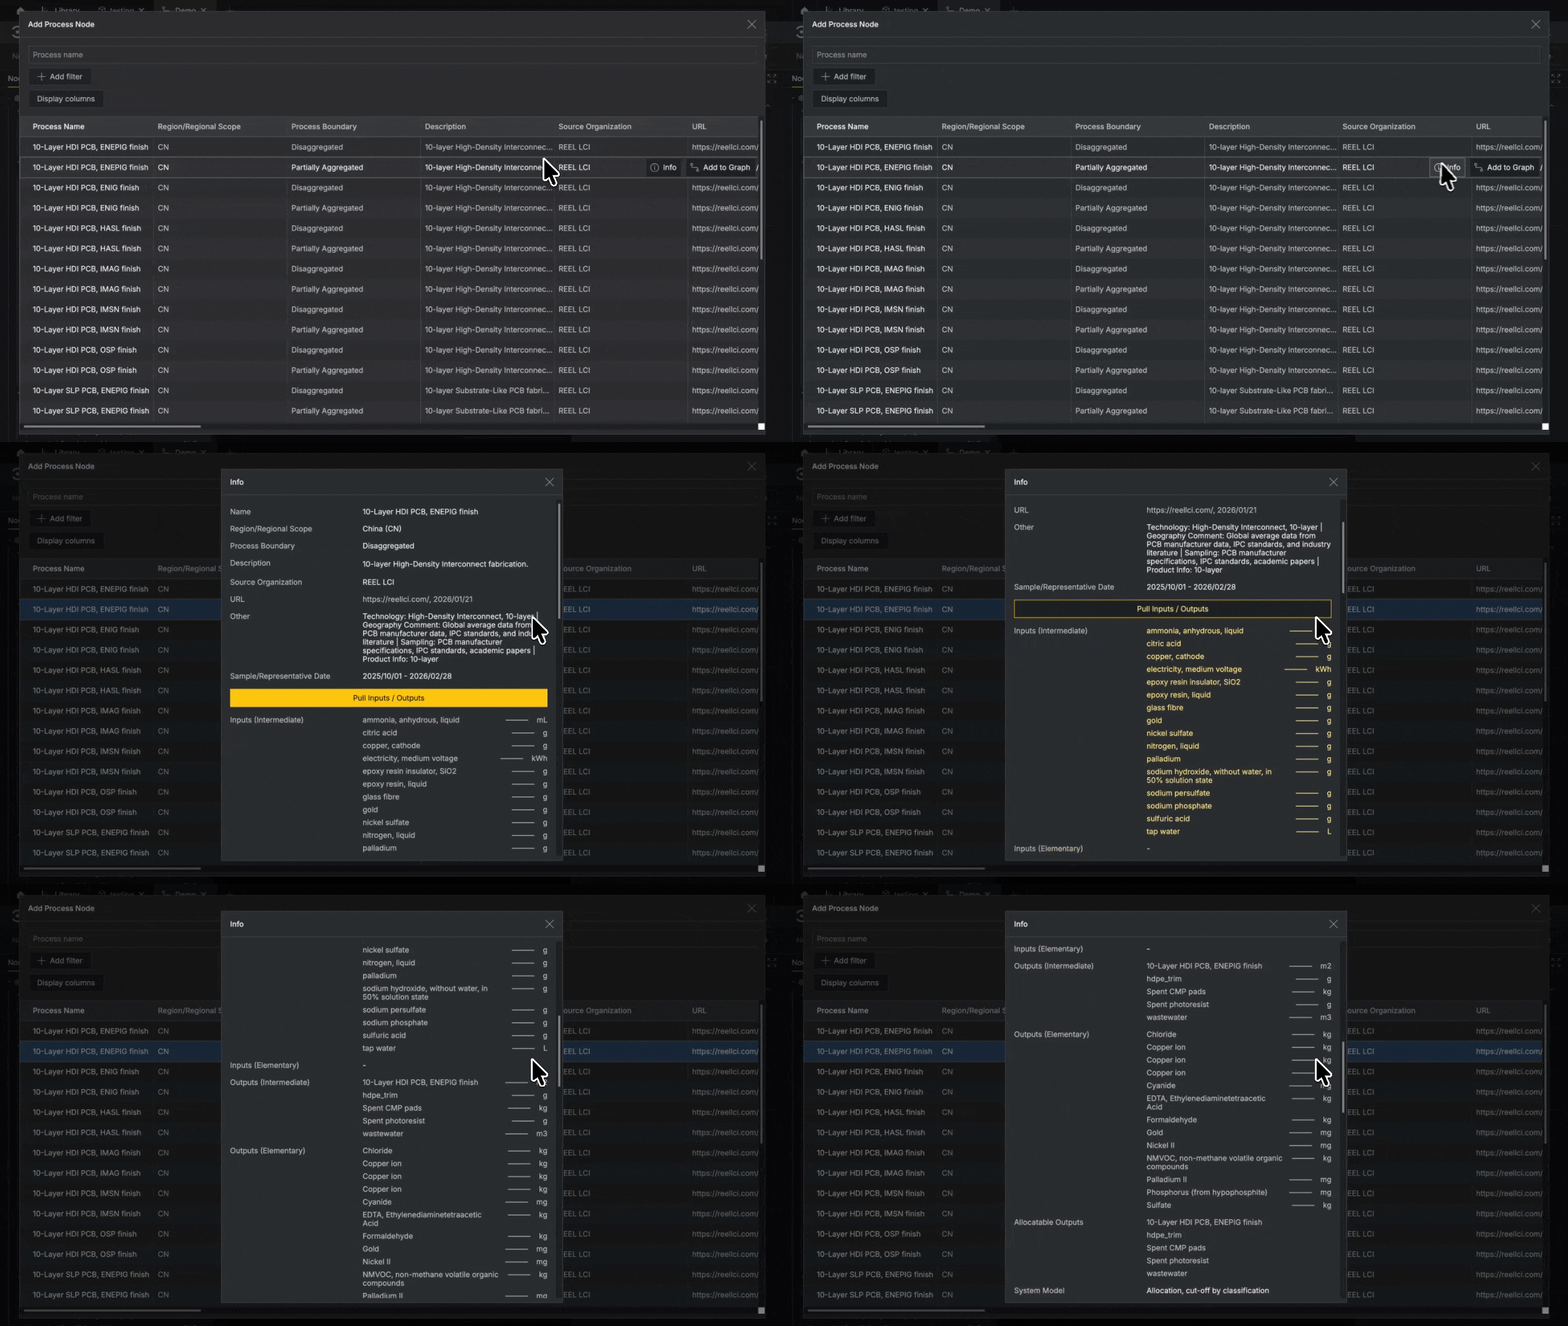
Add the Process to your graph by double clicking the row or clicking the Add to graph button to the right of the row.
From the Library#
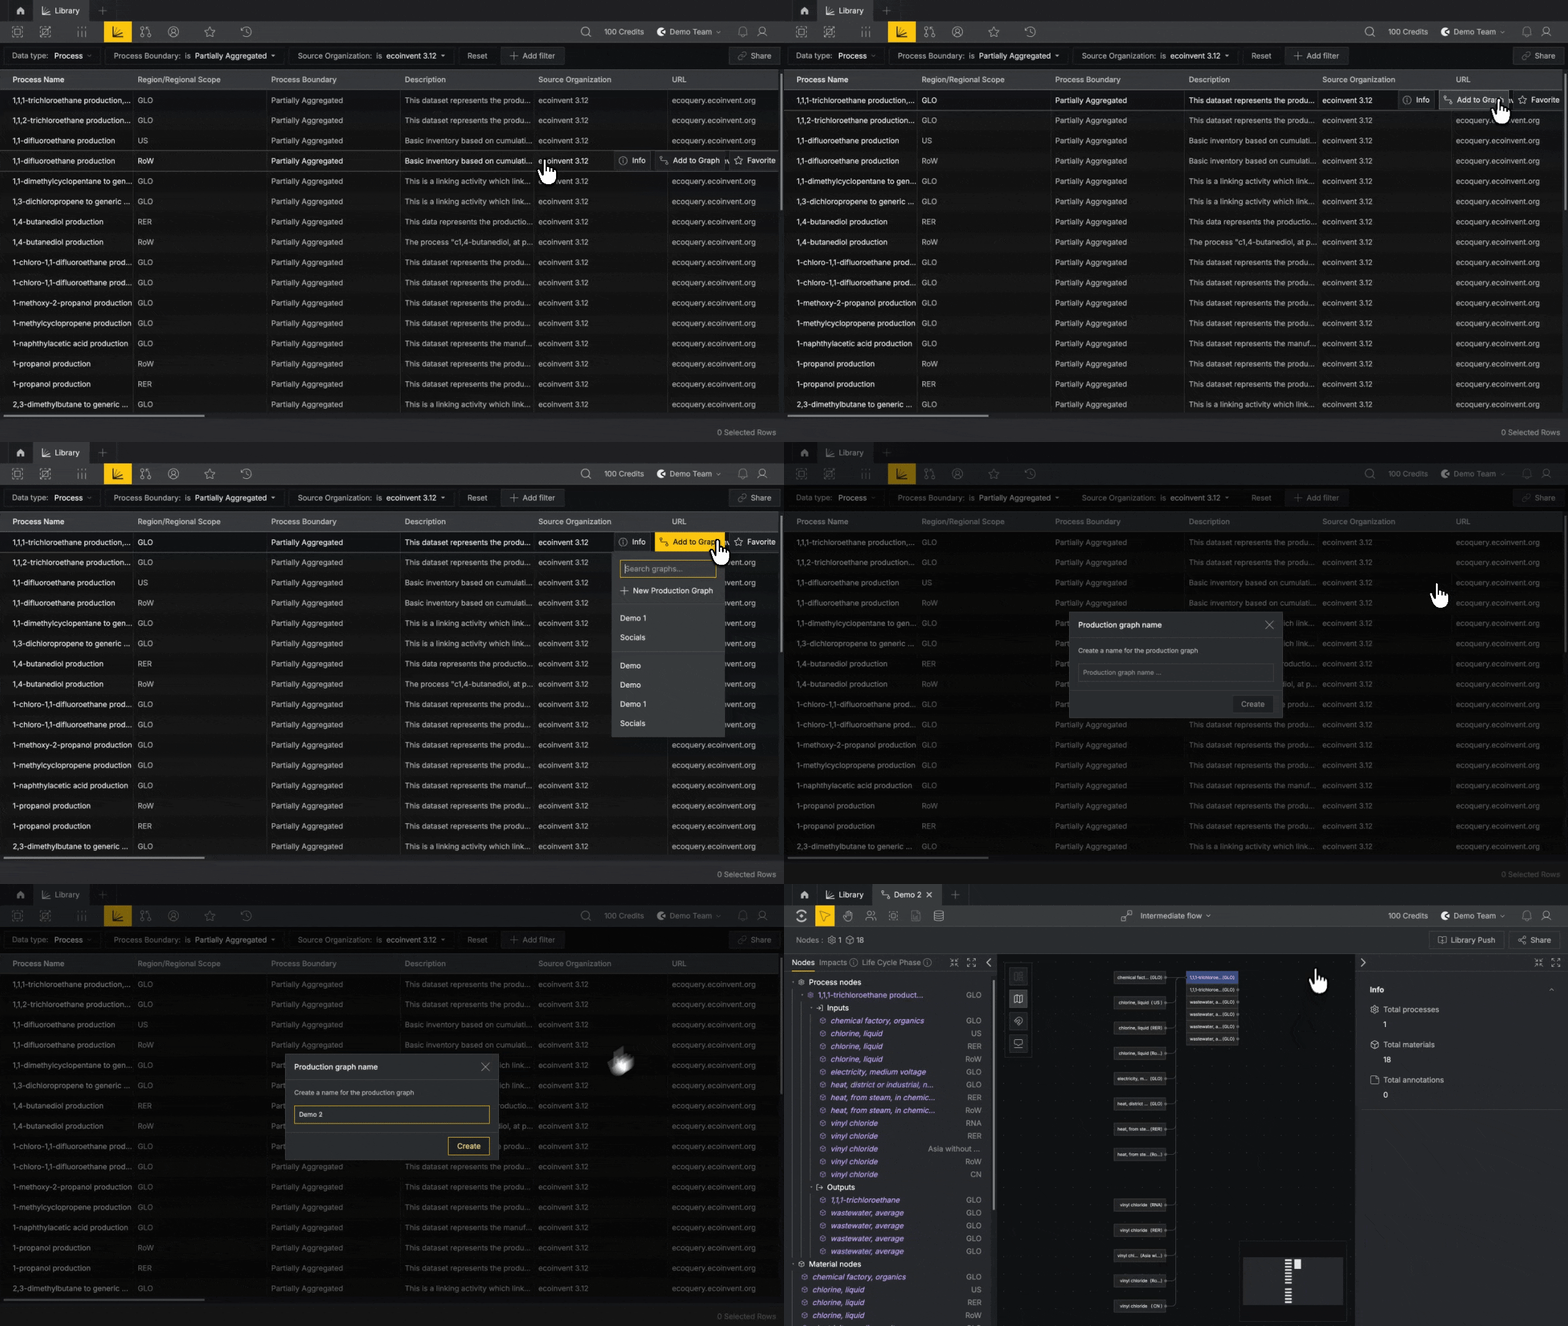
To add a node from the Library, scroll to the right of the dataset you'd like to add to your graph, click the Add to graph button and choose whether to add it to an existing Production graph or create a new one.
Create Your Own Nodes#
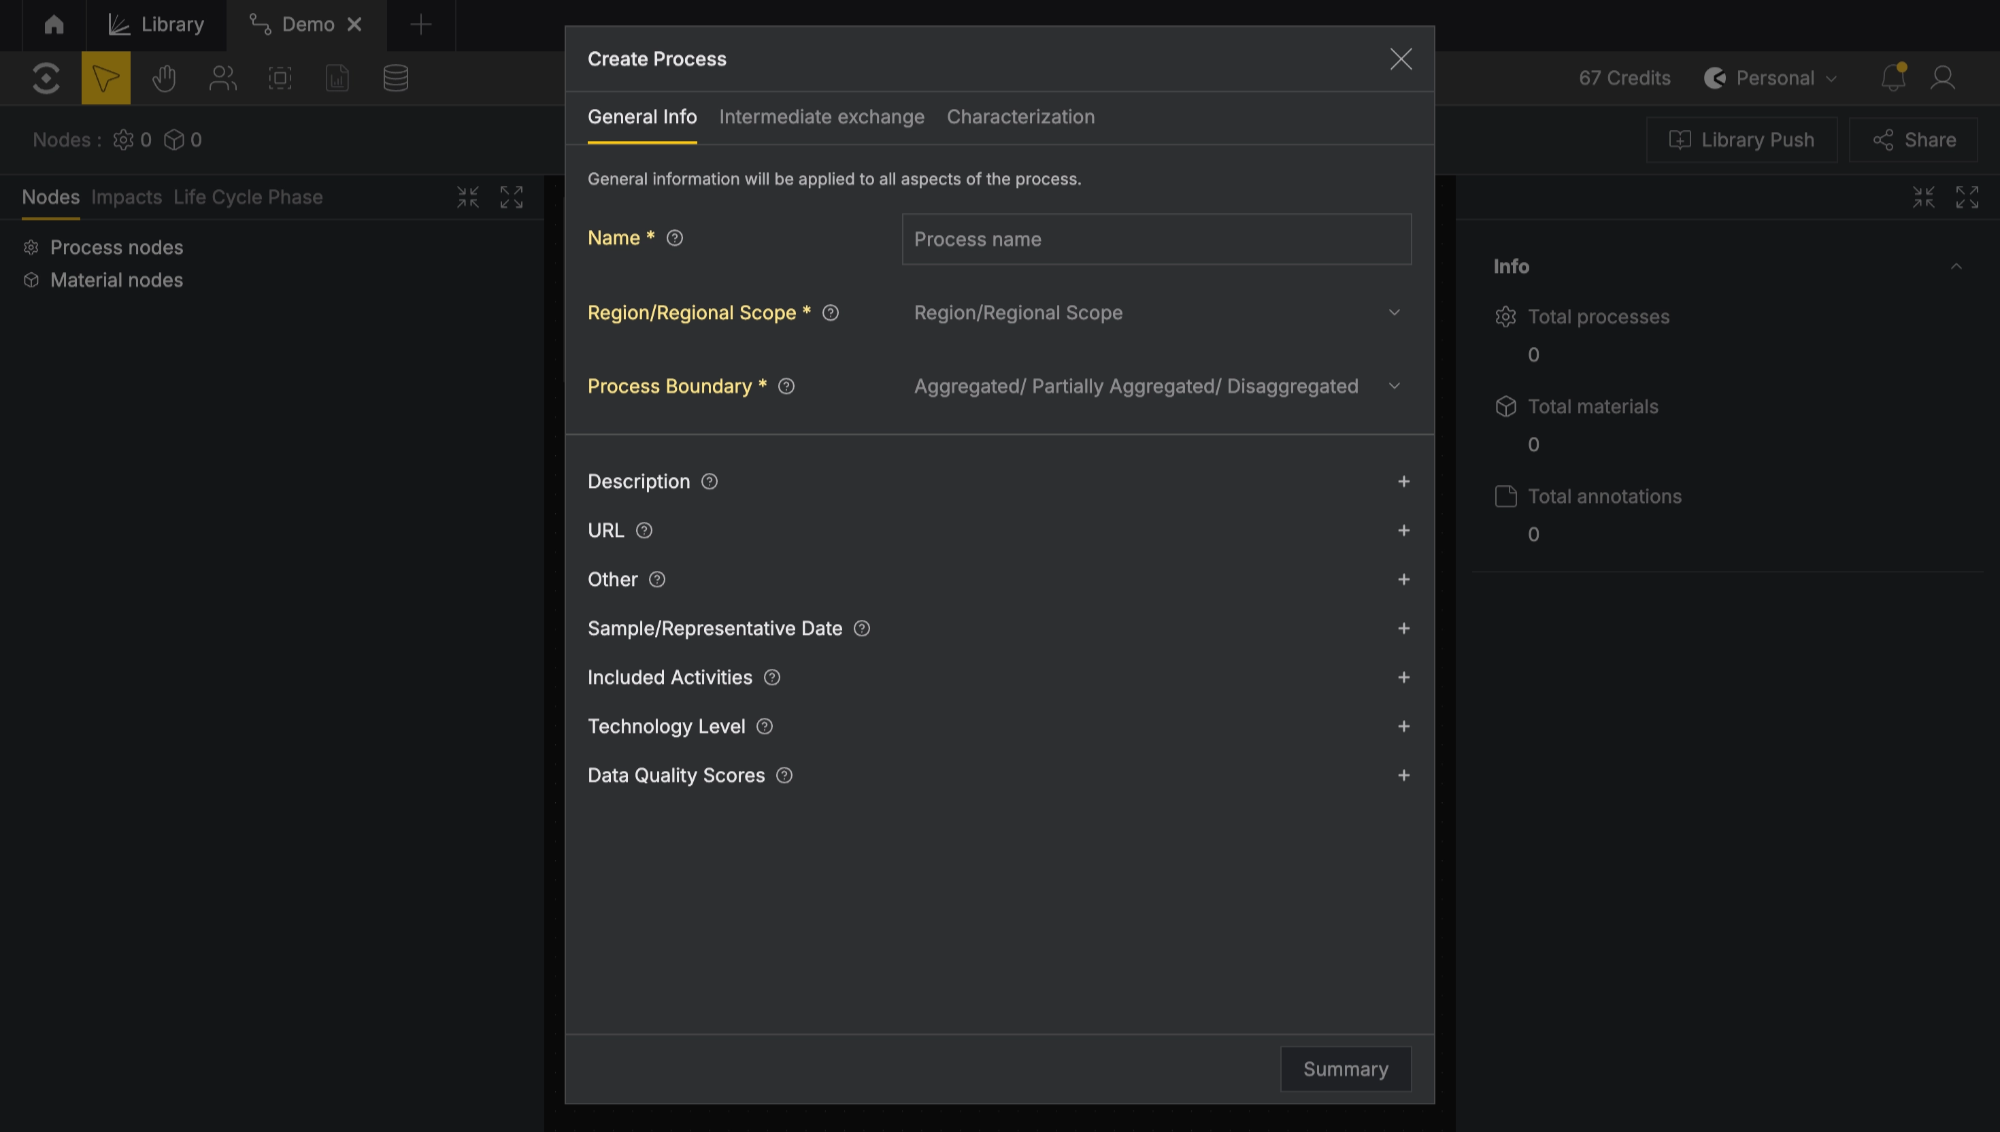
Right-click anywhere on your canvas, hover over Create Node and choose Process or Material. Fill in the form fields to create the node. Details can be updated at any time.
Build Flows#
You can create flows by using the data publisher’s pre-established connections, or link nodes to create your own connections.
Using Pre-established Connections#
Nodes from the database have pre-existing connections established by the publisher which can be used to build flows.
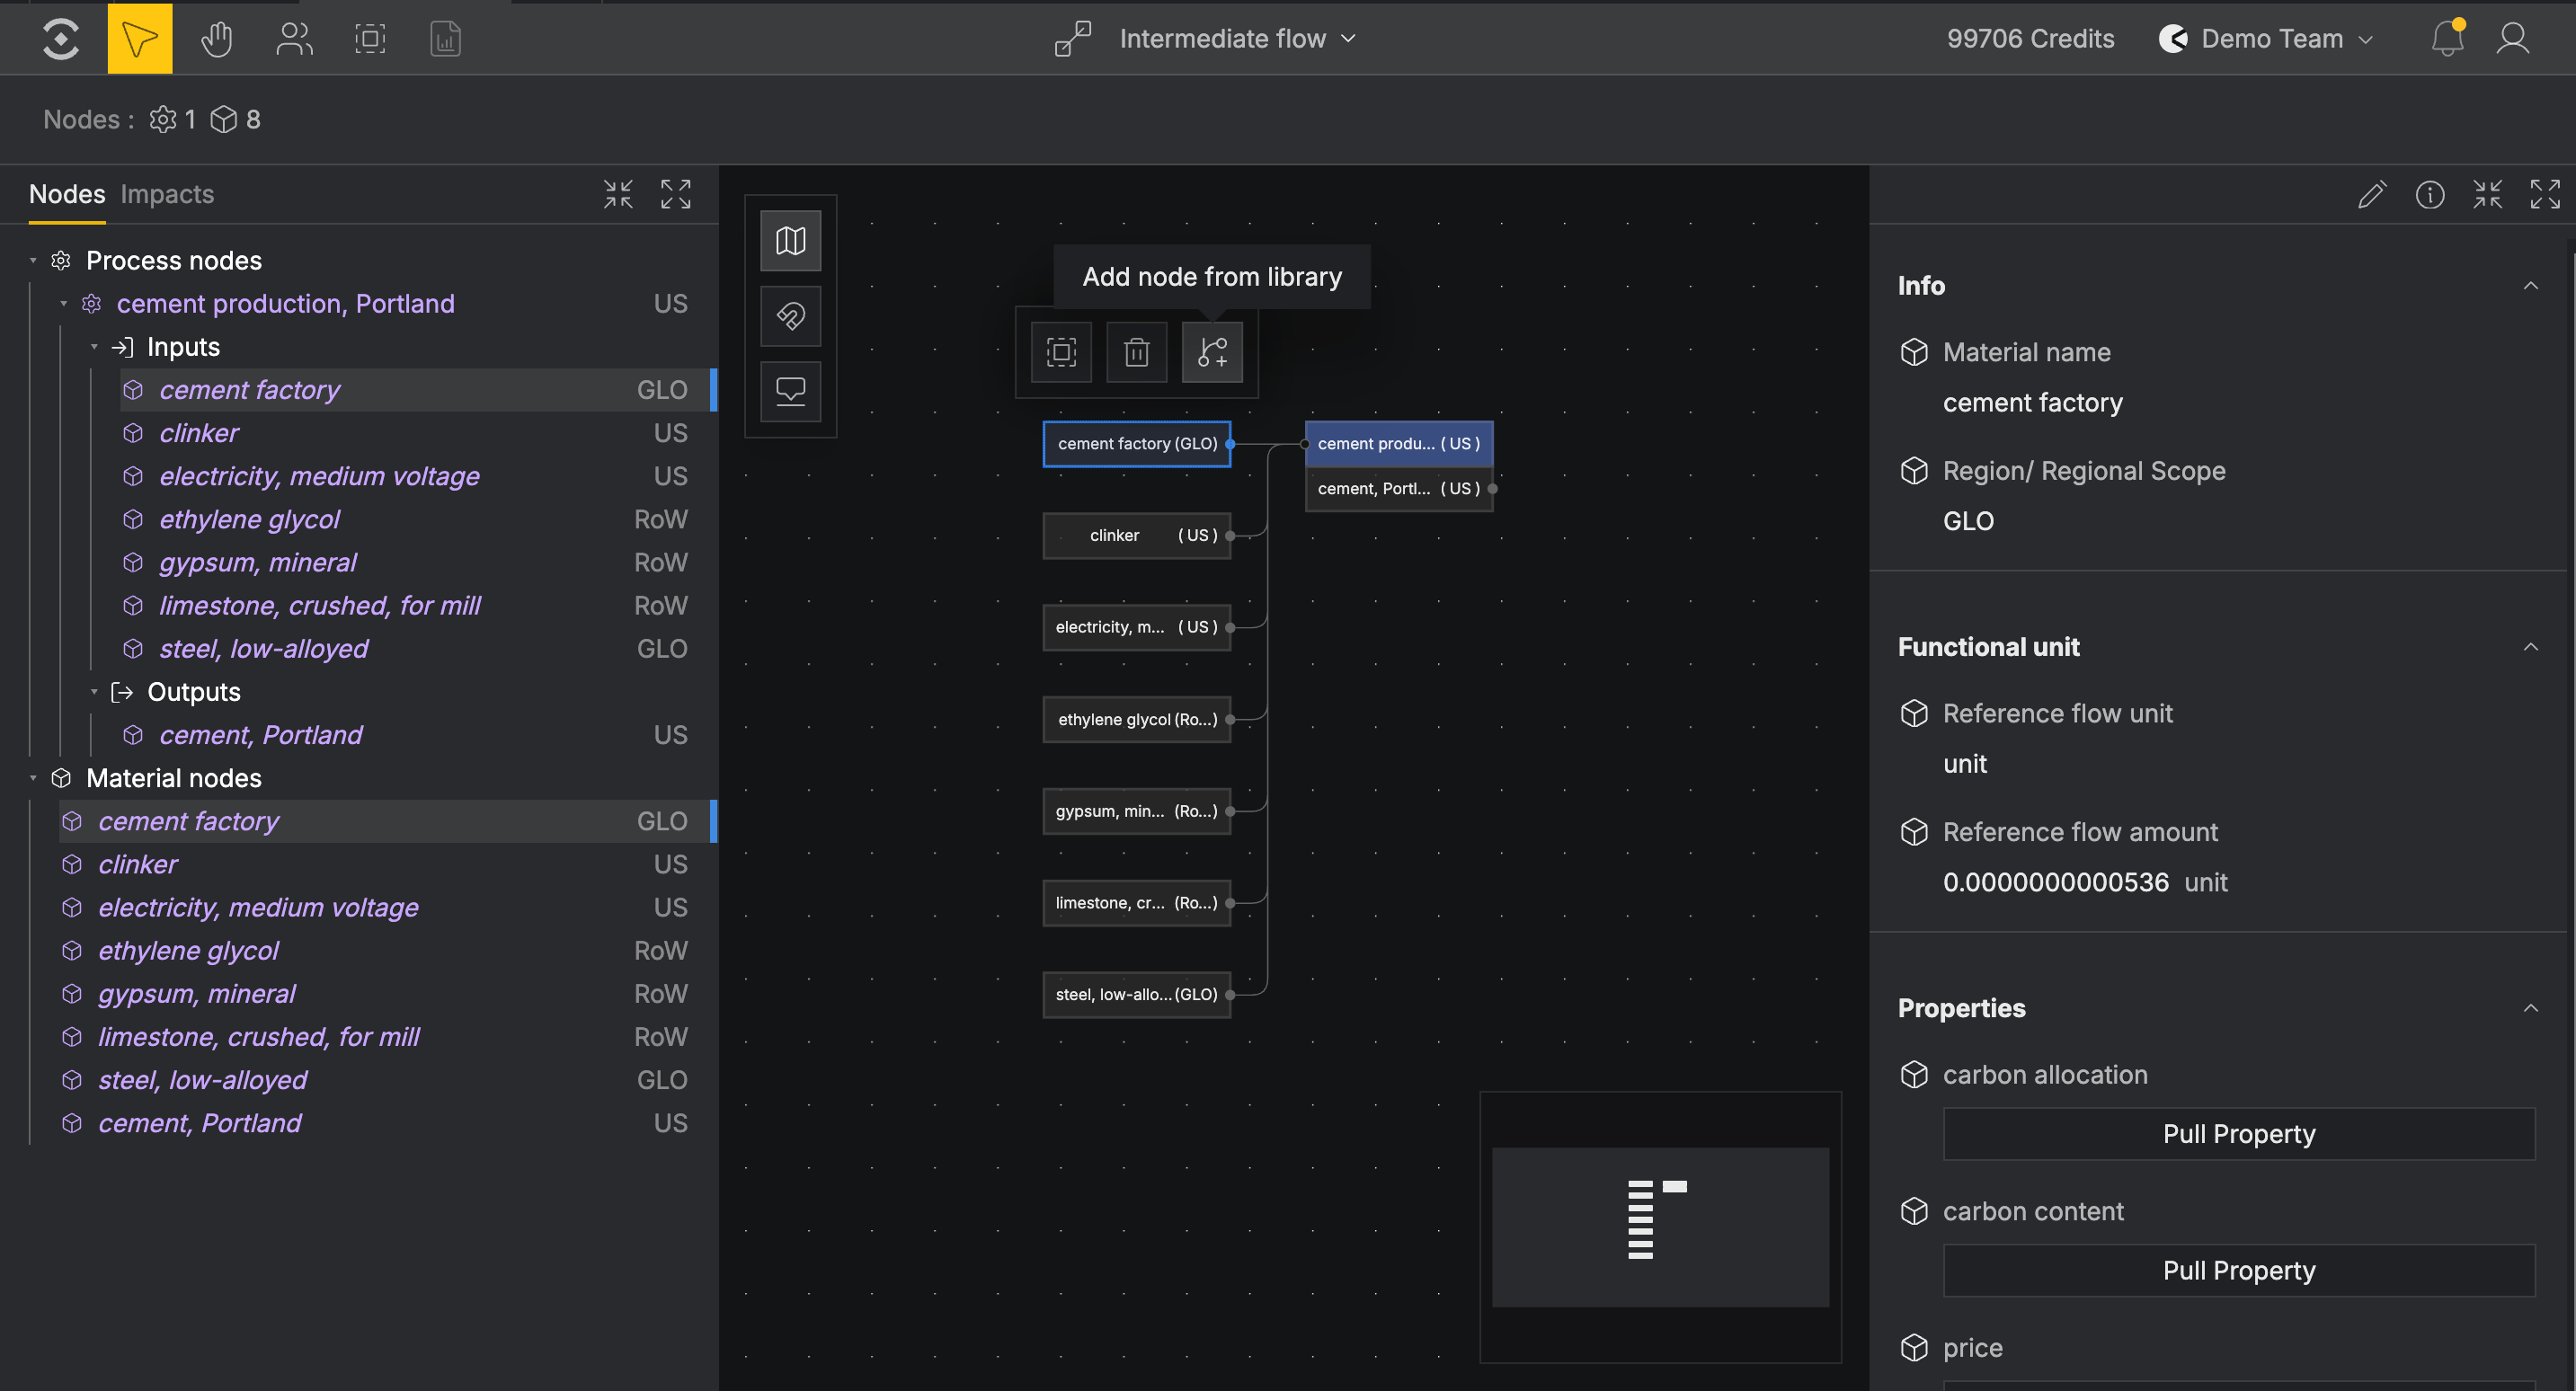
Select a Material node endpoint and click Add node from Library. A filtered view of the database will display the Process(es) the publisher has connected to that Material. Flows can be built either upstream or downstream.
Create your own Connections#
Create connections to establish flows between upstream Processes and your custom nodes, or to build your own custom Processes.
Add an Input:
To add a Material as an input to a Process, hover over the dot on the right side of the Material node. Click and drag to draw a connection line to the Process, then release the line over the process to establish the connection. You will have to set a Batch size, this is the quantity of the Material that is input to the Process.
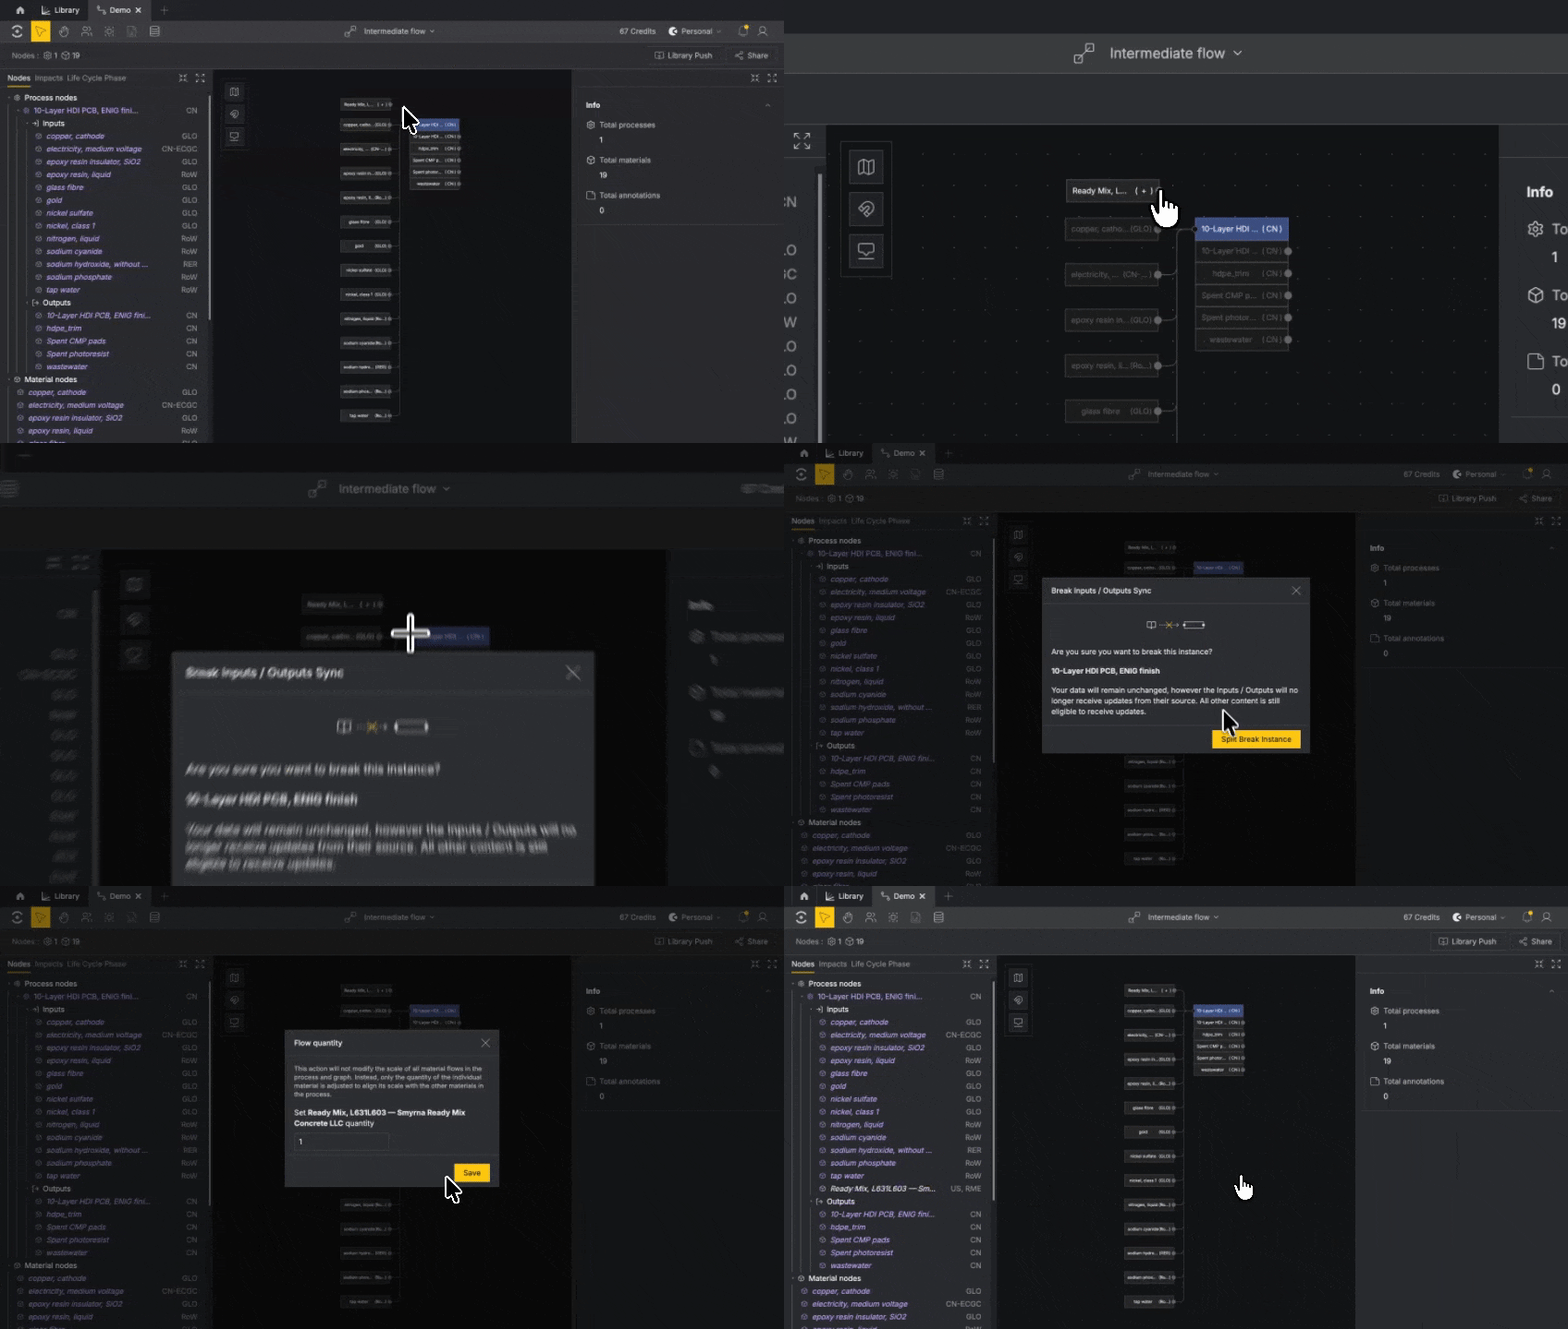
Add an Output:
To add a Material as an output to a Process, click and drag the Material over the Process and release it to snap it as an output of the Process. You will have to set a Batch size, this is the quantity of the Material that is an output of the Process.
Calculate Impacts#
Once you’ve added and connected nodes in your graph, you can calculate impacts.
In order to calculate impacts, you must set a System Boundary and a Reference Point.
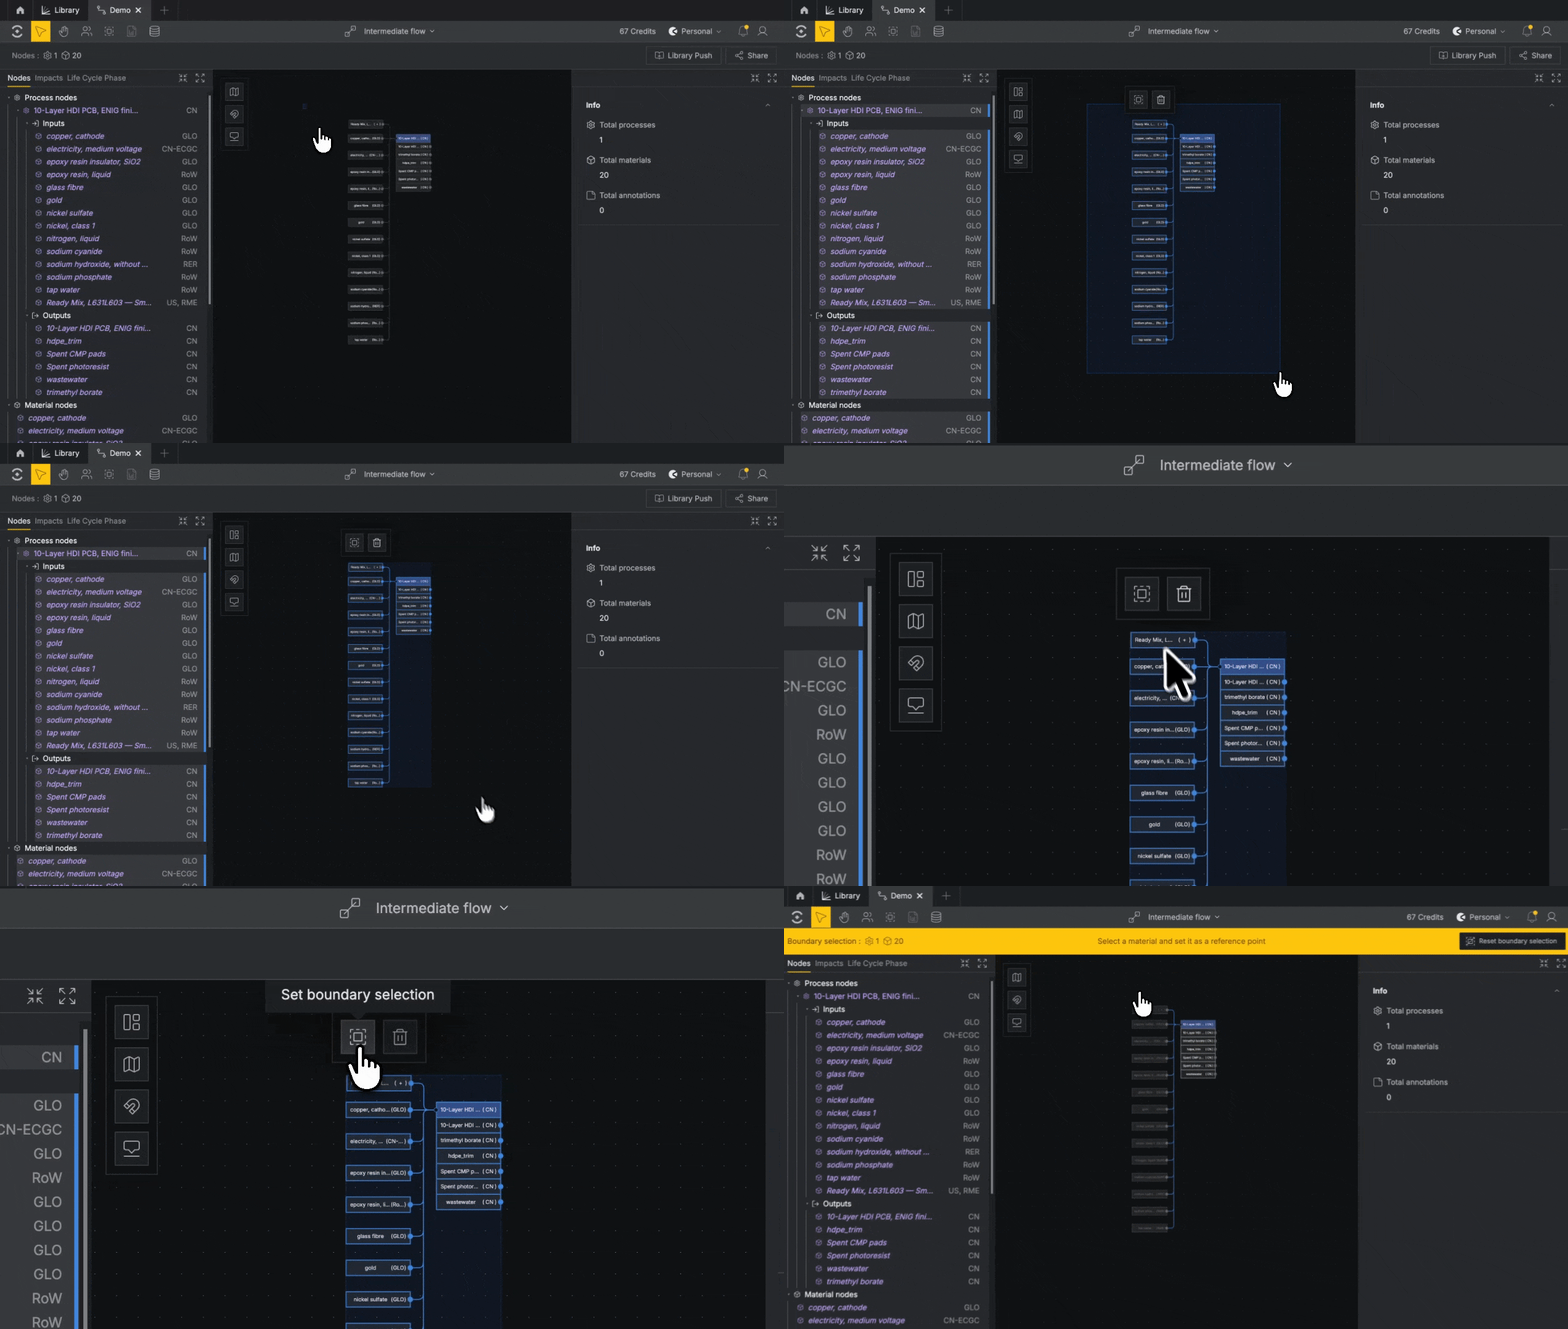
Create System Boundary#
A System Boundary defines which nodes’ burdens should be included in the results.
Click on the canvas and drag-select over the nodes you'd like to include. Selected nodes will be highlighted. Once you've made your selection, click Set boundary selection in the hovering button menu to establish the boundary.
To add or remove individual Material nodes from the boundary, click a node and select Remove from boundary selection from the button menu hovering above your selection.
Set Reference Point#
A Reference Point is a Material node the entire model is normalized to — in most cases, this will be your Functional Unit.
With your boundary set, select the Material you’d like to use and click Set reference point from the hovering button menu.
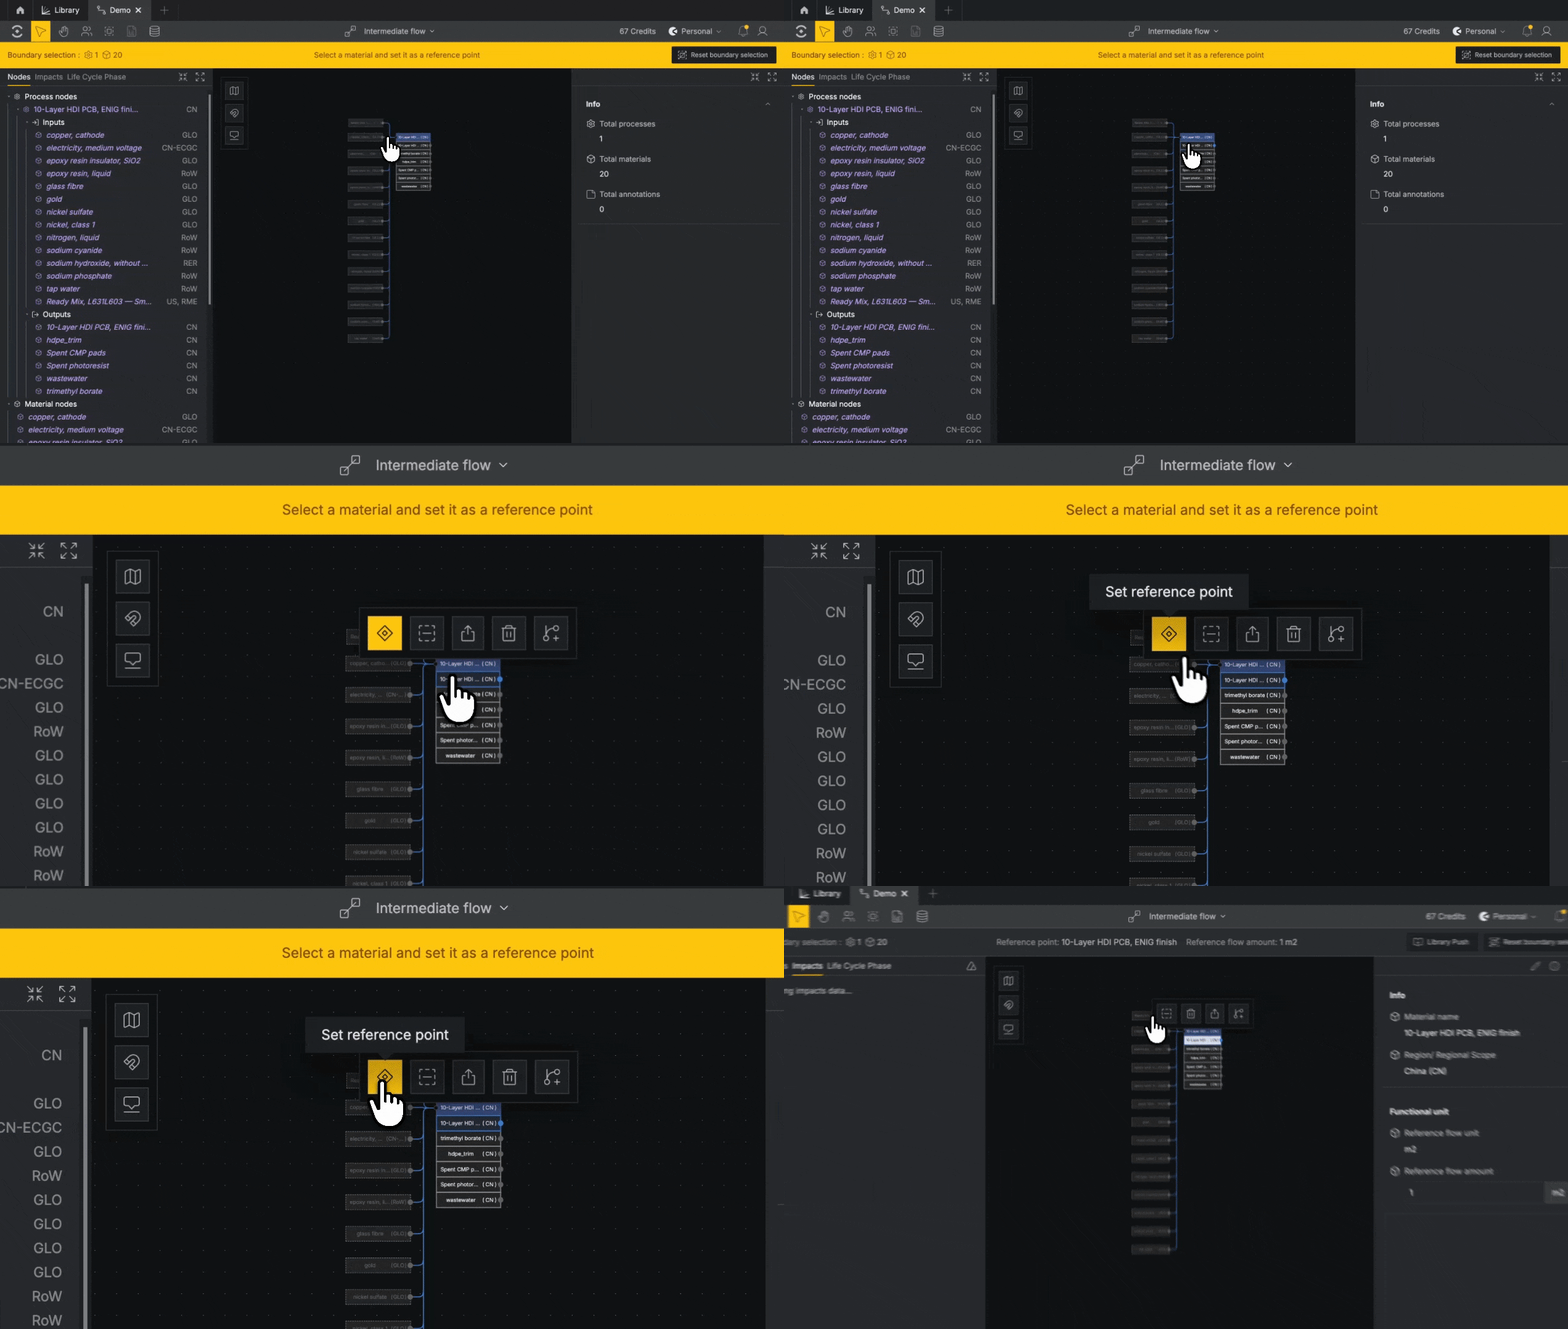
All the Processes in your graph are now normalized, i.e. scaled to the appropriate quantities per unit of your Reference Point.
Pulling Impacts#
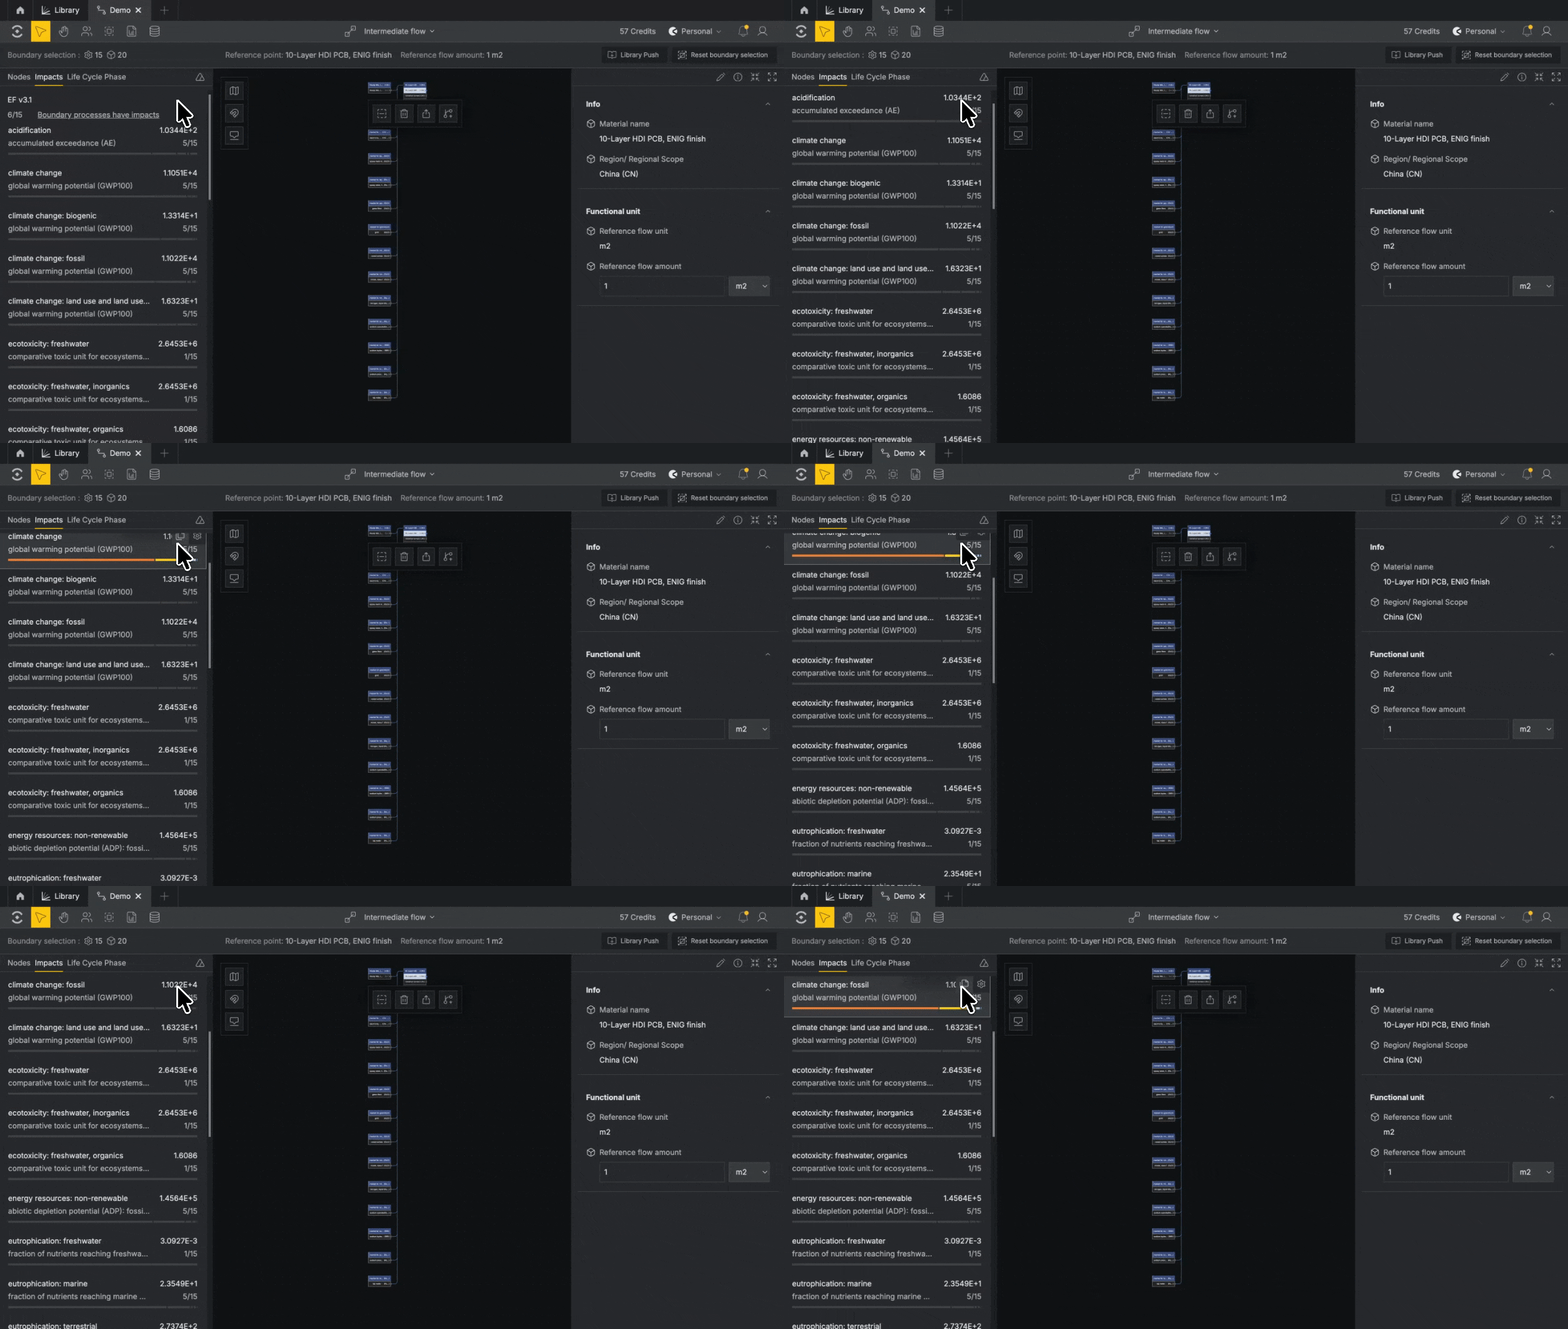
Once your System Boundary and Reference Point are set, the left panel switches to the Impacts tab. It shows the characterization method in use and how many boundary processes have impacts available.
Click Pull Impacts to license the impacts for every process in your boundary. Results appear per indicator in the left panel.
For a full view, click Open Impacts. You can filter by method, category or indicator, and switch between a table and a graph.
Indicator sets#
The indicator set controls which methods and indicators you see. The set in use is shown in the top bar, along with how many indicators it has.
- Switch sets: click the set name in the top bar and choose another. The set is saved on the graph, so everyone working on it sees the change.
- Create or edit a set: click the set name, then
Manage Sets. Click+ New set, name it, tick the indicators you want, and clickSave. Sets are shared with your team and apply across Gesserit, Alia and the Library. - Set your default: in
Manage Sets, select a set and clickMake my defaultin the bottom left. New graphs start with it.
Every team starts with one built-in set, Basic — EF v3.1 no LT (5 indicators). To add more, open Manage Sets, click + New set, add the indicators you need and click Save.
Generate a Report#
Create a detailed .xlsx export of your results.
Once a Boundary and Reference Point are set, the Generate report button in the top bar will activate.
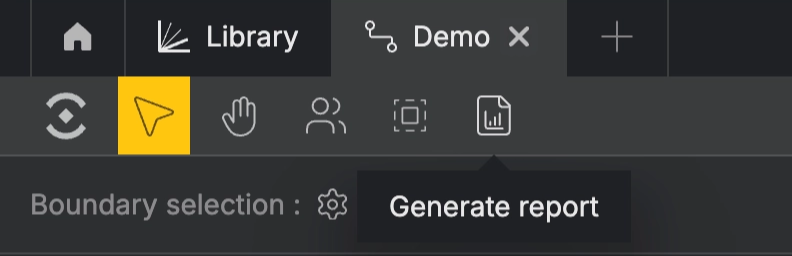
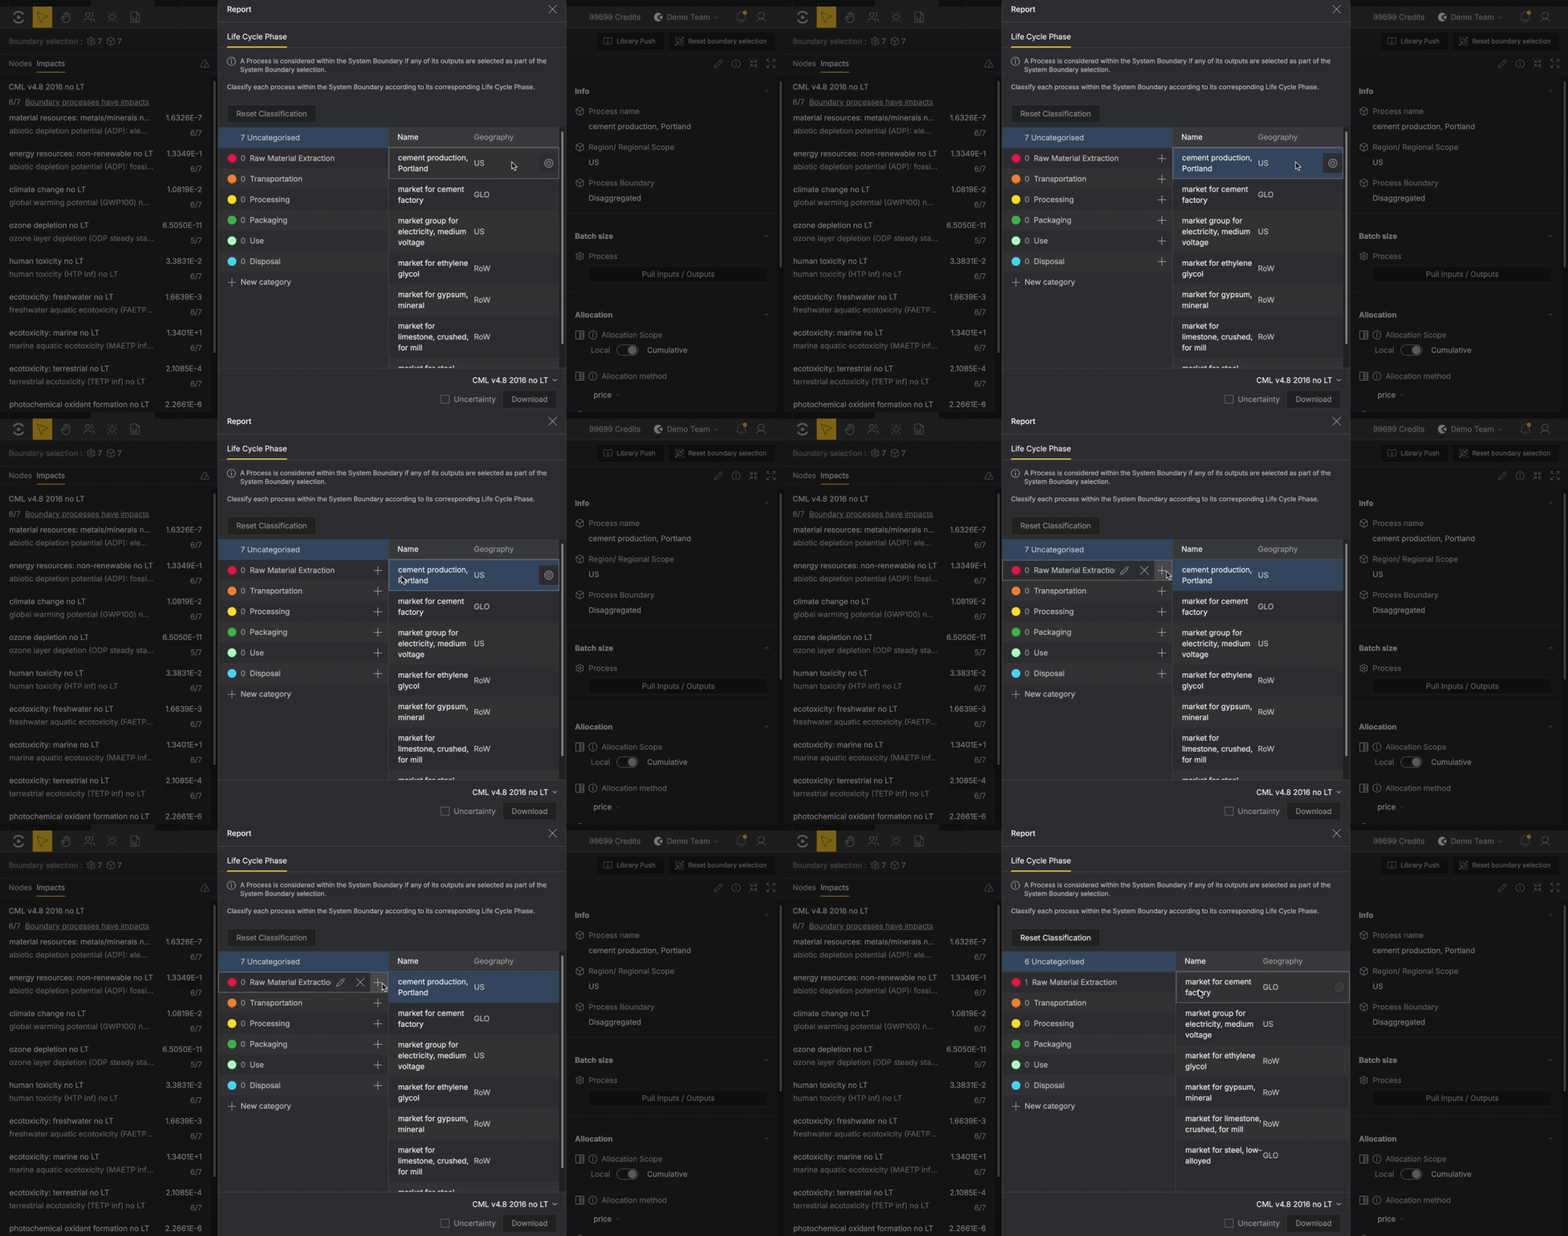
After clicking the Generate report button, you must classify the Processes in your graph into their Life Cycle Phases for the report. You can rename phases or add your own custom phases.
Classify your Life Cycle Phases directly in the modal after clicking Generate report.