
Processes are now available as Partially Aggregated datasets, meaning the input of each Process is automatically linked to an Aggregated upstream supplier Process. This gives you the detail of a Disaggregated Process without having to add an upstream supplier Process for every input yourself.
Below shows what a connected input with an upstream supply process looks like compared to one that's missing one.
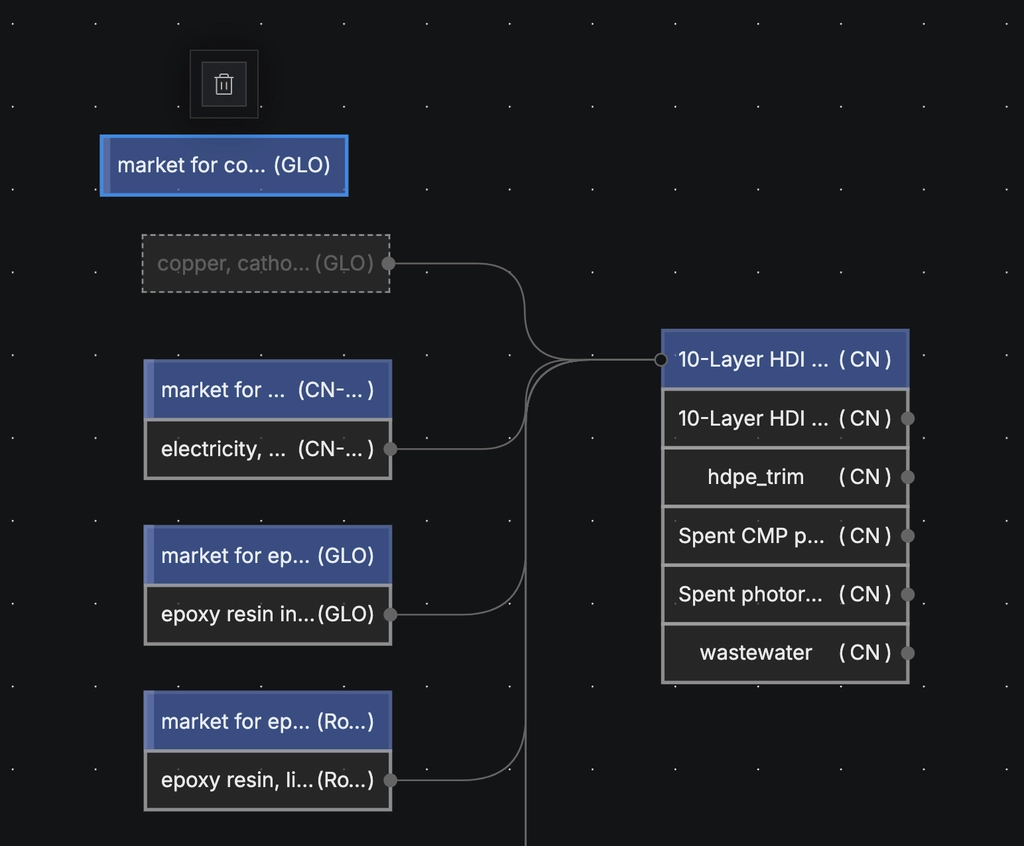
For Partially Aggregated Processes, impacts are only available to view inside our modeling environment, Gesserit.
The steps below explain how to add a Partially Aggregated Process to your graph and view impacts.
Add partially aggregated processes to your graph#
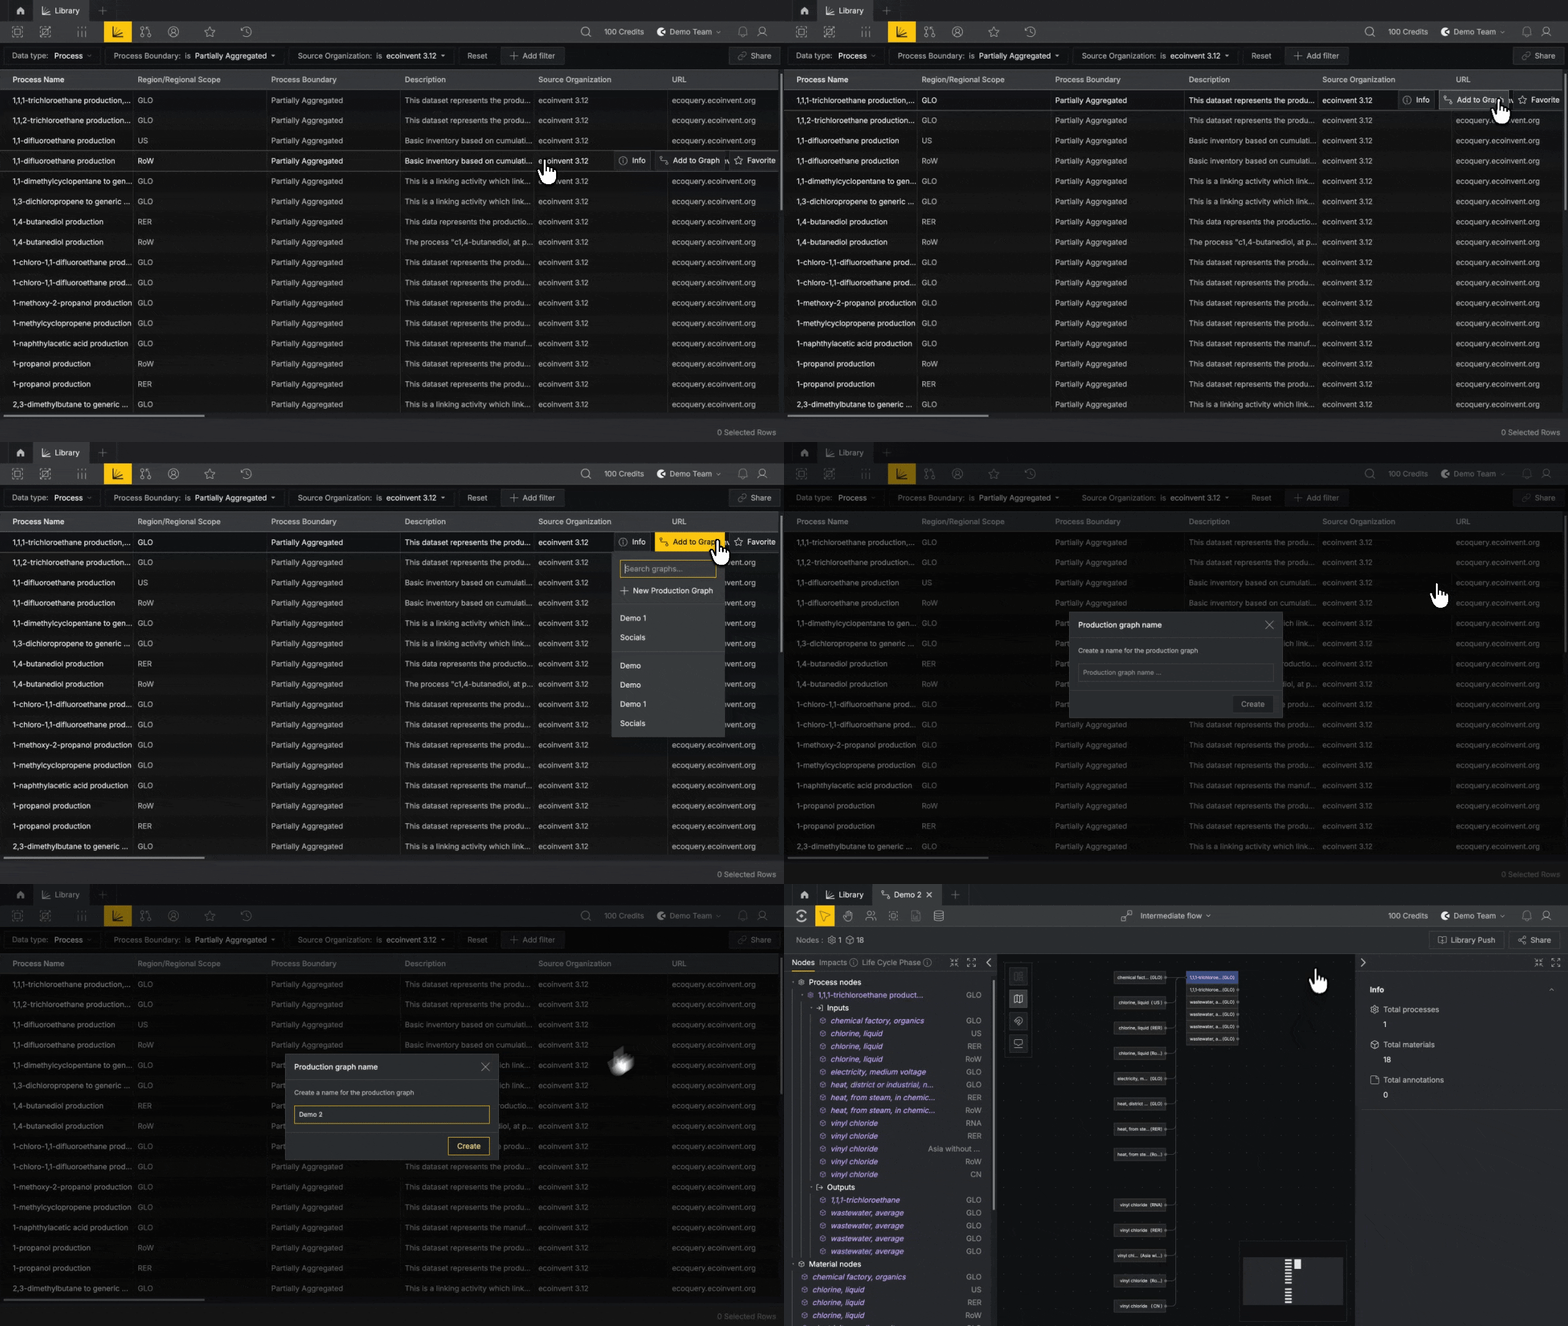
You can add Partially Aggregated Processes two ways: from the Library or from directly within your graph.
From the Library#
Apply a filter to your Library search to show only Partially Aggregated datasets.
Click Add filter, then Process Boundary → Partially Aggregated
Some Processes may not have a Partially Aggregated version.
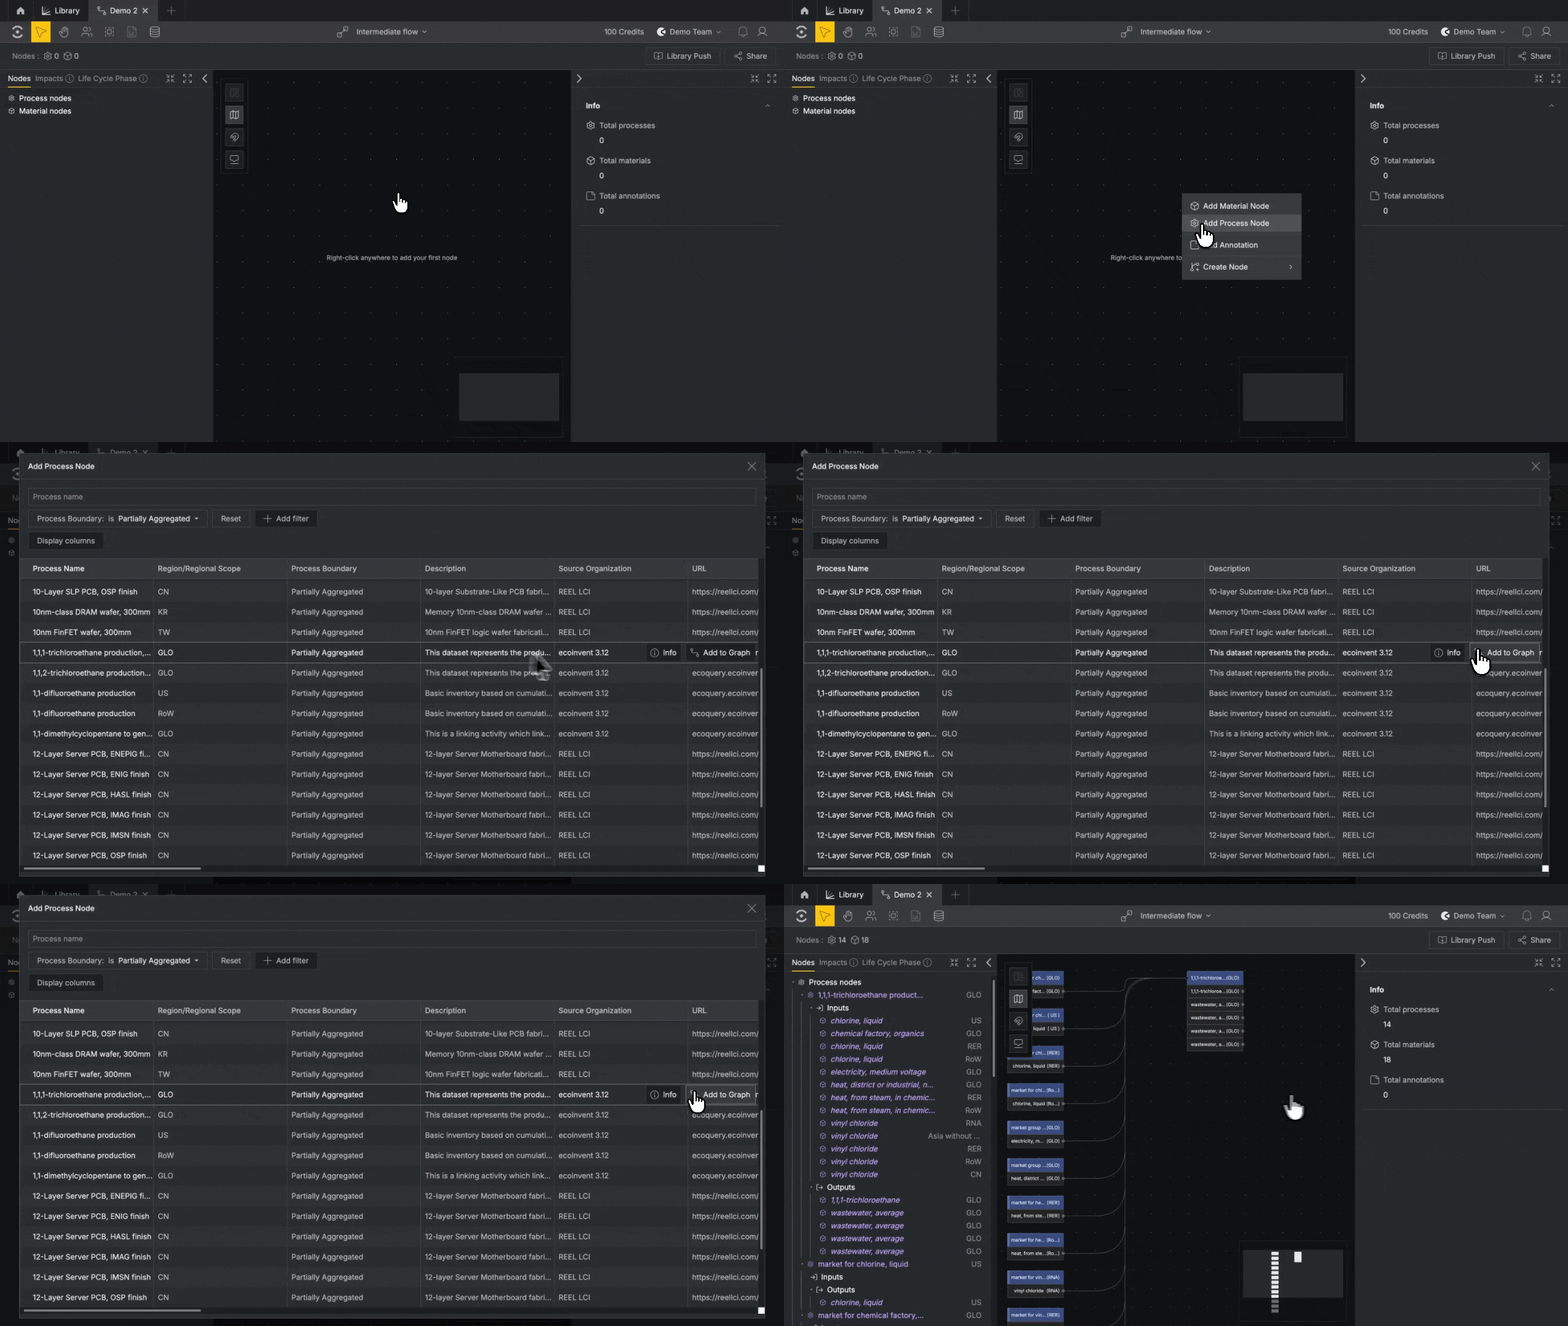
From your graph#
Right-click anywhere on the canvas, then click Add Process Node.
Click Add filter, then Process Boundary → Partially Aggregated to display only Partially Aggregated datasets.
View impacts in your graph#
Once the Process is added to your graph, create a Boundary Selection and set a Reference Point around the main node and its upstream inputs.
For more detailed explanation on setting a Boundary Selection and Reference Point, see Begin modeling.
Once the System Boundary and Reference Point are set, the left panel switches to the Impacts tab and shows the indicators in your graph’s indicator set.
Click Pull Impacts to license impacts for every process in the boundary, or click Open Impacts for the full table.
To change which indicators appear, switch the indicator set in the top bar. See Begin Modeling for how indicator sets work.
